The interconnectedness of Donbas and Crimea with other regions has acquired critical political importance both at the level of daily interactions between Internally Displaced Persons (IDPs) and their new communities and at the level of national discourse. Therefore it is important to change research optics and consider Donbas and Crimea neither as a part of big macro-region, nor as “outstanding” or “exotic” cases, but as parts of Ukrainian society that are interconnected with other regions. With this in mind, the experience of and attitude toward IDPs, as well as attitudes toward Crimea and Donbas, can offer insights about the country as a whole.
 The Russian annexation of Crimea and armed conflict over Donbas have brought these regions into the limelight. At the same time, there is a lack of sufficiently complex analysis of Ukrainians’ attitudes toward Donbas and Crimea and their understanding of what is happening there. Traditional analyses of Ukrainian attitudes divide the country into large macro-regions, resulting in a misleading grouping of diverse oblasts (Ukraine’s administrative regions). This module changes that optic, presenting data by oblast for a more nuanced view of attitudes and understanding throughout Ukraine.
The module consists of two parts. Map layers in the first part visualizing inter-regional mobility (ie whether respondents have visited certain areas) as well as their attitudes toward inhabitants of these areas, beginning from the pre-Euromaidan period.
The second group of layers shows Ukrainians’ attitudes about the situation in Donbas and Crimea and its fallout. Several maps visualize how respondents rank Ukraine’s problems, such as the armed conflict in the East, in terms of importance. Others present data on Ukrainians’ opinions about the conflict, their attitude toward IDPs (measured through the social distancing toward IDPs from Crimea and IDPs from Donbas), and the number of officially registered IDPs in each oblast between 2015-2019.
The election of President Zelensky is viewed as strong indication that ending the war and finding a diplomatic solution to the conflict over Donbas is of utmost importance to Ukrainians throughout the country. However, this issue can also become divisive; survey data indicate that readiness to compromise with Russia and make certain concessions may greatly differ region by region. The country’s future political stability and security depends upon a more nuanced and localized understanding of how these events are characterized, who or what is blamed for the situation, and which options are the preferred strategies to end the conflict.
The map layers presenting data about registered IDPs point to an unprecedented mobility, caused by the annexation of Crimea and the beginning of the armed conflict in Donbas. These events resulted in displacement of over two million people.
Data for this module were collected in small bits from various international and Ukrainian research centers (UNHCR, University of St.Gallen, Center for Social and Marketing studies “Socis”, Info Sapiens, Rating Group Ukraine).
This project is in copyright. If you reproduce any map, please refer to:
- Maps for March 2013, March 2015 and October-November 2017. Data Source: University of St. Gallen. The survey was carried out by Rating Group (in 2013) and “Socioinform” Centre (in 2015 and 2017) for the University of St Gallen project "Region, Nation and Beyond. An Interdisciplinary and Transcultural Reconceptualization of Ukraine". In all oblasts and the parts of Donbas controlled by the Ukrainian government, personal standardized face-to-face interviews were conducted based on a multi-stage quota. The sample (n=6,000 split proportionally between all oblasts) was aligned with age (respondents aged 18 and older) and gender quotas representative of Ukraine’s profile with respect to the largest administrative units (oblasts), types of settlement (from villages to cities over one million), with a margin of error of approximately 2%.
- Maps based on the Rating Group Ukraine data, December 2018. Data Source: Rating Group Ukraine; Project “Portraits of Ukraine” November 16-December 10, 2018. In all oblasts and the parts of Donbas controlled by the Ukrainian government, personal standardized face-to-face interviews were conducted based on a multi-stage quota. The sample (n=40,000 split proportionally between all oblasts) was aligned with age and gender quotas representative of Ukraine’s profile with respect to the largest administrative units (oblasts), types of settlement, with a margin of error of approximately 2.4% at the oblast level and 0.5% at the all-Ukrainian level.
- Maps based on the Info Sapiens Omnibus data, 2019. Source: Info Sapiens Omnibus. Monthly sample includes 1,000 individuals aged 16+. Survey method: face-to-face interviews at respondent's home. Nationally representative sample excludes occupied areas of Crimea and Donbas. The sample (n=12,000) split proportionally between all oblasts) was aligned with age (respondents aged 16 and older), and gender quotas representative of Ukraine’s profile with respect to the largest administrative units (oblasts), types of settlement (from villages to cities over one million), with a margin of error of approximately 2%.
- Maps based on online media consumption in Donetsk and Luhansk oblasts (GCA and NGCA) surveywas conducted by Info Sapiens for Chemonics International Inc.: DG EAST on October 29 – December 9, 2019. Sample (n=1,600). Computer-assisted face-to-face interviews were conducted in government controlled areas of Donetsk and Luhansk oblasts. Each subsample represents oblast by age/sex/settlement size according to the data of State Statistics Service of Ukraine as of 1/01/2018. The theoretical sample error does not exceed 3.5% for the subsample with probability 0.95.
- Maps based on the “Socis” data, November 2017. Data Source: The Center for Social and Marketing studies “Socis”. Personal standardized face-to-face interviews were conducted in all oblasts and the parts of Donbas controlled by the Ukrainian government based on a multi-stage quota. The sample (n=20,000 split proportionally between all oblasts) was aligned with age and gender quotas representative of Ukraine’s profile with respect to the largest administrative units (oblasts), types of settlement, with a margin of error of approximately 1%.
- Maps based on the “Socis” data, September 2018. Data Source: The Center for Social and Marketing studies “Socis”, Personal standardized face-to-face interviews were conducted in all oblasts and the parts of Donbas controlled by the Ukrainian government based on a multi-stage quota. The sample (n=10,000 split proportionally between all oblasts) was aligned with age and gender quotas representative of Ukraine’s profile with respect to the largest administrative units (oblasts), types of settlement, with a margin of error of approximately 1.5%.
- Maps based on the “Socis” data, January 2019. Data Source: The Center for Social and Marketing studies “Socis”. Personal standardized face-to-face interviews were conducted in all oblasts and the parts of Donbas controlled by the Ukrainian government based on a multi-stage quota. The sample (n=11,000 split proportionally between all oblasts) was aligned with age and gender quotas representative of Ukraine’s profile with respect to the largest administrative units (oblasts), types of settlement, with a margin of error of approximately 1.5%.
- Maps illustrating number of officially registered IDPs in each oblast between 2015 and 2019. Data Source: Ukrainian government data provided by the UNHCR.
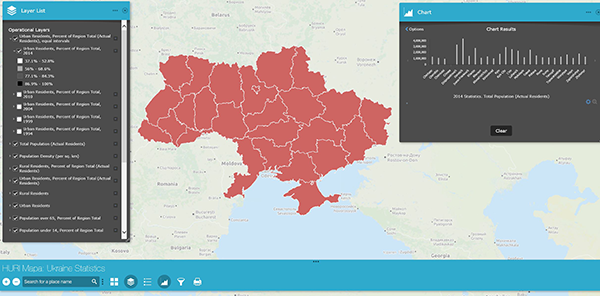
Note: The hosting platform - ESRI's ArcGIS Online Web AppBuilder - automatically detects your web browser language preference. Although the application was built in English, a localized map viewer user interface provides instructions and menu links in a localized language, based on your browser preferences.
View the Donbas and Crimea Web Map