The language issue in Ukraine has long historical roots, and even after Ukraine’s independence it remained in the center of the nation- and state-building processes. Different political parties often used language tensions for political mobilization or to draw imagined regional divisions. It also served as an important marker in defining cultural and national identities or allegiances. However, after the Euromaidan it took on a new dimension. Fueled by the Revolution of Dignity, subsequent annexation of Crimea, and ensuing war, the changes in Ukraine’s sociolinguistic landscape were not so unidirectional. On the one hand, those events contributed to intensive reflections on and a (re)articulation of the role of Russian-speaking Ukrainians in the process of political nation-building, making them a part of a new national heroic narrative. On the other hand, Russia used the language question as a pretext for occupying or annexing Ukrainian territories, and actively exploited the issue in its propaganda war and disinformation campaign. These factors could have pushed many Ukrainian citizens to change their attitudes toward language practices and the coexistence of Ukrainian and Russian languages in the country. In some circumstances, Russian-speaking Ukrainians may have decided to adopt the Ukrainian language for daily communication in order to forestall Russian aggression or out of patriotic reasons. Through the MAPA “Language” module, we can explore and visualize changes in the sociolinguistic landscape of Ukrainian society between 2013 and 2017.
Methodology
Quantitative studies exploring the sociolinguistic landscape of Ukraine typically focus on three groups of questions. The first might be called “language self-description or language identification”. This group usually includes questions about respondents’ native language(s), the importance of a particular language for respondents’ ethnic or national identity, the estimated level of language proficiency, and so on. The second group relates to respondents’ language practices in both private (family) and public domains (work, education, entertainment, etc.). The last one might include a wide range of questions measuring respondents’ attitudes to language practices and policies conducted by different actors (state, NGOs, representatives of parties or parliament, private enterprises, etc.) from a local to global level and in all possible spheres of life. The MAPA “Language” module’s structure reflects those three main “themes”; however, some of its comparative maps crosscut those categories and combine questions belonging to different groups.
In a quantitative survey, both attitudes and self-reported language identities and practices might be subject to sensitive silencing or adjustment. This happens when respondents’ practices and opinions contradict dominant expectations or ideologies, especially in a situation of intense political conflicts (like Euromaidan) or ongoing war (military conflict in Donbas). In these situations, respondents might provide the answer they think is more socially acceptable.
Moreover, quantitative language studies in Ukraine are often criticized for leveling differences between the big cities and surrounding countryside because they present mean values for Southern and Eastern macro-regions or separate oblasts. As a result, the presented data does not reflect the real language situation in those regions and contributes to stereotyping them as heavily Russophonic. Methodologically, it is very difficult to overcome this issue because presenting data that goes beyond macro-region or oblast division requires a much higher sample than presenting averages requires. In the ”Language” module this problem is addressed by 1) adding a separate map layer depicting languages spoken at home in all oblast centers of Ukraine based on the 2015, 2016, and 2017 Ukrainian Municipal Surveys conducted by the Rating Group Ukraine and sampling 800 respondents in each city; 2) adding a separate group of layers for the questions (variables) based on the 2013-2015 “Region, Nation, and Beyond: An Interdisciplinary and Transcultural Reconsideration of Ukraine” surveys (sampling over 6000), where respondents’ answers are presented separately for the oblast centers and the rest of the population for select South and Eastern Ukrainian oblasts. Bearing in mind that the second group of maps is subject to a greater margin of error, one should use these maps with some reservations.
The other issue to bear in mind is that although the quantitative approach allows us to incorporate variables into more sophisticated statistical models as well as to perform spatial data analysis, researchers and respondents unavoidably face the inherent bias of a predefined list of answers. Scholars, based on their own experience or theoretical background, must decide arbitrarily which language alternatives are included and which are left out (for example, should surzhyk be included in the list of alternatives alongside such “normative” options as “Ukrainian” or “Russian”? Or, how can we ask about multiple manifestations of bi- or tri-lingualism in Ukraine?)
Consequently, a complex study of language identities and practices also requires the application of other research methods such as participant observation, textual analysis of autobiographical documents, or an experiment accompanied by in-depth interviews or focus-group discussions. Some additional qualitative data on language practices in Ukraine were collected as part of the University of St. Gallen project, “Region, Nation, and Beyond: An Interdisciplinary and Transcultural Reconsideration of Ukraine".
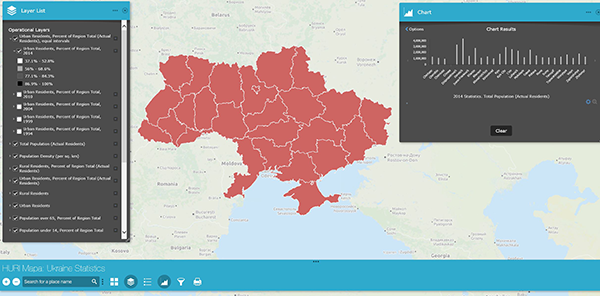
The “Language” module is structured as a set of web maps presenting the regional (oblast level) division of respondents’ self-described language practices and identities, as well as their attitudes toward language policies in Ukraine. In addition, those language maps can be compared with maps presenting respondents’ attitudes toward the historical past, the Euromaidan, the annexation of Crimea, and the Donbas conflict. There is also a built-in functionality to combine them with the statistics web maps, which visualize a number of demographic, social, economic, and political variables describing Ukraine in 1994, 1999, 2004, 2010, and 2014.
Two map layers representing the annexed territory of Crimea and occupied territories of Donetsk and Luhansk regions can be turned on to indicate that the 2015 surveys were not conducted in those territories. To conduct geospatial analysis, users can turn on thematic (color) map layers and then overlay chart map layers containing comparative data from several surveys (mostly the St. Gallen’s 2013 and 2015 surveys). With these data sets, users can pose their own research questions and seek answers using the interactive web map’s the built-in tools (widgets).
Clicking within each map layer causes a pop-up window to appear, displaying data attributes represented on that section of the map along with the full text of the survey question. For more information see the user guide or consult the video tutorials.
Data source
Studies that make use of geospatial analysis based on recent sociological surveys data in Ukraine must involve a much larger number of respondents than typical surveys to compare oblast data at a statistically significant level.
The University of St. Gallen project “Region, Nation, and Beyond: An Interdisciplinary and Transcultural Reconsideration of Ukraine” aimed to overcome the simplistic four macro-region division that researchers frequently use to analyze Ukraine. Two surveys conducted in March 2013 (funded by the Swiss National Foundation) and March 2015 (funded by the Wolodymyr George Danyliw Foundation and the Swiss National Foundation) formed the basis for the spatial data analysis presented in the “Language” module. Both surveys drew from a countrywide sample representative of Ukraine’s demographic profile with respect to all administrative units, types of settlement (from villages to cities of over one million), gender, and age (respondents aged 18 and older). The number of respondents was large enough (n=6000, margin of error ≈ 2%) to represent each oblast separately in our maps, thus avoiding unnecessary macro-regional grouping.
The other data visualized in the “Language” module comes from a survey conducted by the Razumkov Center in December 2015 titled “The Formation of the Common Identity of Ukrainian Citizens in New Circumstances: Peculiarities, Prospects and Challenges.” (The survey was funded by the Swedish International Development Cooperation Agency [SIDA], the Konrad Adenauer Foundation, and Social Transformation in Ukraine and Moldova [Matra]). It also had a large sample (n=10071, margin of error ≈ 1%) and was representative of Ukraine’s profile with respect to all administrative regions, settlement size, gender, and age (respondents aged 18 and older).
Finally, data from the Ukrainian Municipal Surveys were used to create a separate map layer that depicts languages spoken at home in all oblast centers of Ukraine:
- March 2–20, 2015 (n=17600: 800 respondents in each of 22 Ukrainian oblast centers, excluding Donetsk, Luhansk, and Simferopol, margin of error ≈ 3.5%)
- January 20 – February 8, 2016 (n=19200: 800 respondents in each of 24 Ukrainian oblast centers, excluding Simferopol, margin of error ≈ 3.5%)
- January 20 – February 12, 2017 (n=19200: 800 respondents in each of 24 Ukrainian oblast centers, excluding Simferopol, margin of error ≈ 3.5%)
Ukrainian Municipal Surveys were conducted on behalf of the International Republican Institute (IRI) by the Rating Group Ukraine and funded by the Government of Canada through the Department of Foreign Affairs, Trade and Development (DFATD).
Using the data from all these surveys, we mapped responses on the 26 administrative regions where the interviews took place. For interviewers’ and interviewees’ safety, the 2015 surveys were not conducted in occupied Crimea or Donetsk and Luhansk oblasts, which were not under Ukrainian control.
This project is in copyright. If you reproduce any map, please refer to:
- Maps for March 2013 and March 2015. Map Source: Ukrainian Research Institute, Harvard University. © 2017 The President and Fellows of Harvard College. Data Source: University of St. Gallen. Financial support: 2013 – the Swiss National Foundation, 2015 - the Wolodymyr George Danyliw Foundation and the Swiss National Foundation.
- Maps for December 2015. Map Source: Ukrainian Research Institute, Harvard University. © 2017 The President and Fellows of Harvard College. Data Source: Razumkov Center. Financial support: the Swedish International Development Cooperation Agency (SIDA), the Konrad Adenauer Foundation, and Social Transformation in Ukraine and Moldova (Matra).
- Maps based on the Rating Group Ukraine data. Map Source: Ukrainian Research Institute, Harvard University. © 2017 The President and Fellows of Harvard College. Data Source: Rating Group Ukraine; International Republican Institute; Department of Foreign Affairs, Trade and Development, Government of Canada.
Note: The hosting platform - ESRI's ArcGIS Online Web AppBuilder - automatically detects your web browser language preference. Although the application was built in English, a localized map viewer user interface provides instructions and menu links in a localized language, based on your browser preferences.
View the Web Map